Original:
Correlation Between Group Studying and Science Exam Scores
Ashley Mota, Bilal Siddiqui, and Rania Ebrahim
Abstract
Getting good grades depends on your study habits. One study habit whose efficiency has been talked about is the use of study groups. If planning on using a study group as a way to study, then it is important to know how exactly does the use of a study group correlate to the scores attained on a test. Surveys were conducted in this experiment to collect data which would give insight to answering this question. 57 participants of varying ages, genders, and science majors were asked a series of questions amongst which two were: “What was your last grade on a science exam?” and “How many people did you study with?” It seemed that the more people studied with ( 5 or more), the higher the average exam scores were (98). Even when looking at the individual grades, the grades that had more students studying in groups (Sophomores) seemed to have a higher average exam scores (88.6). However, more research can still be done to explore any other factors that could have affected the high exam score, such as how long they were studying for, were they studying with friends and goofing off, did they get enough sleep, and/or what was their level of prior knowledge in the subject.
Introduction
Getting good grades in one of the most important goals for college students. How well students do is chiefly determined by their study habits. Every student has their own study habits which they feel comfortable with. Study habits such as getting organized, develop a study plan, find a study area, and create study groups. While the more one studies has a positive effect on scores, other study habits may have different effects. The goal of this study was to determine whether individual studying or studying in groups for science exams is most effective for students at the City College of New York. Generally, science exams cover a wide range of topics. Because of this, it is hypothesized that students who work in groups will have scored better than those who study individually. Studying in groups allows students to explain to each other topics they may be weak in, and they can improve (Rybczynski, 2011).
Methods
The participants of this experiment are 60 City College of New York undergraduate students (30 female and 30 male) from different majors such as computer science, engineering, biology, and etc. A survey was given with several questions on their study habits. Questions about gender, age, major, year of college, grade of last science exam, the average number of people they study with, and would they change the average number of people that they mostly studied with or not were asked. The participants were chosen randomly around the CCNY campus such as in cafeterias, computer labs, and entrances. The library was considered an unsuited place to ask students to do the survey because it would be obvious to observe who was studying independently or in group, which would eliminate randomness. Data collected from survey answers were used to indicate the relationship between study groups and better grades. Once data was collected, an excel sheet was used to organize the different patterns observed. A Chi Square Calculation was used to determine whether there was an actual correlation between number of people in a study group and individual grades.
Results
As shown below in figure 1, the average exam score of: those who studied by themselves (46.7% of the people surveyed) was 83.7, those in groups of 1-2 people (31% of the people surveyed) was 80.2, in groups of 3-4 (12%) was 92.2, and group of 5 or more (6.7%) was 95.5.
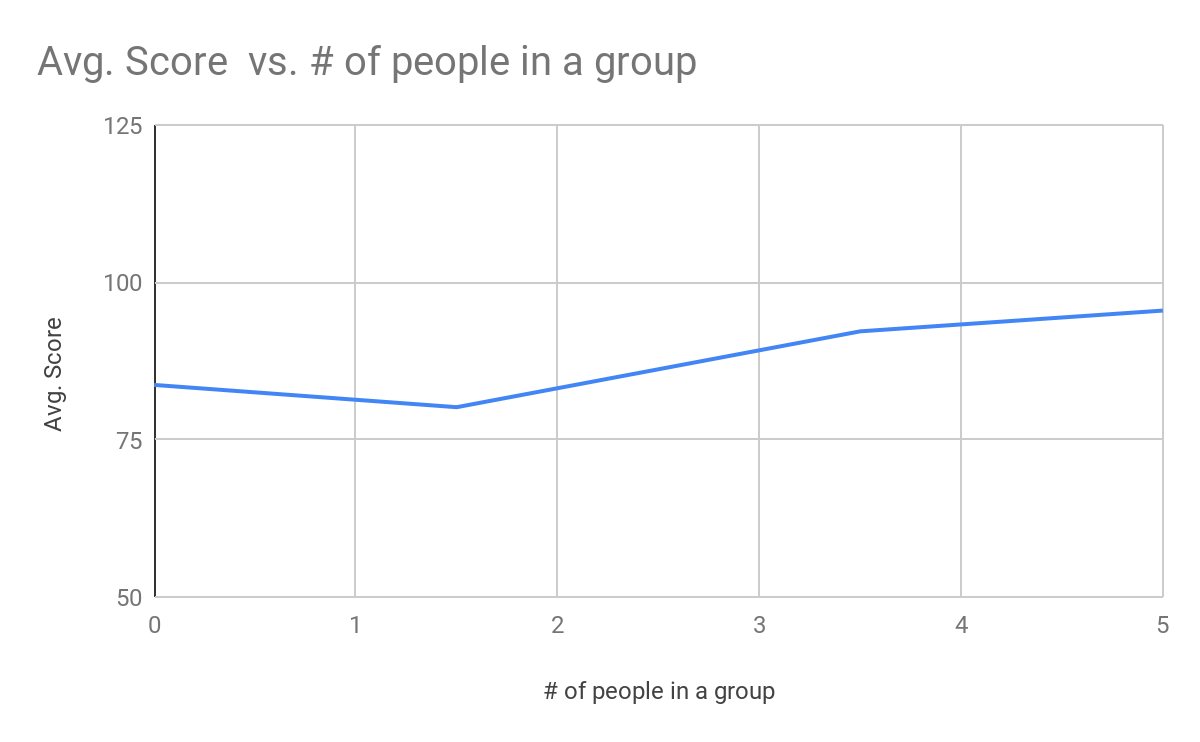
Figure 1. Depiction of the relationship between # of people in a study group and how they scored on an exam.
When looking at the individual grades of the participants, we noticed that 16 of them were freshman (28%), 18 of them were Sophomores (32%), 11 of them were Juniors (19%), and 12 of them were Seniors (21%). Seniors were more likely to study by themselves and rarely in groups, whereas freshman had a 50/50 chance of studying by themselves or in groups. Sophomores were most likely to study in groups, mostly in size of 1-2. The juniors had almost a 50/50 percent of studying by themselves or in a group. Figure 2 depicts this information.
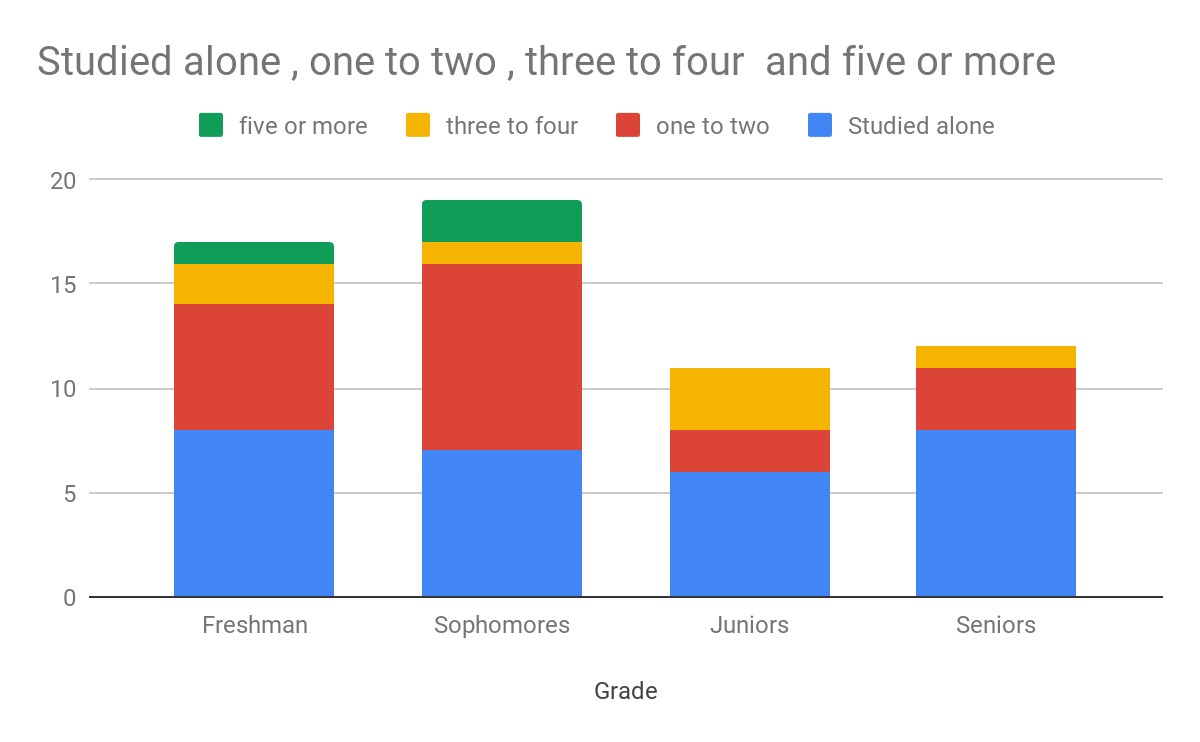
Figure 2. Stacked bar chart showing a variance in how the different grades chose to study.
The average exam score was then found per grade. Freshman and Seniors, who had high percentages of studying by themselves, were found to have the lowest scores, 79.6 and 77.7 respectively. Whereas Sophomores, who had a high percentage of studying in groups, had the highest score (tied with Juniors) at 88.6.
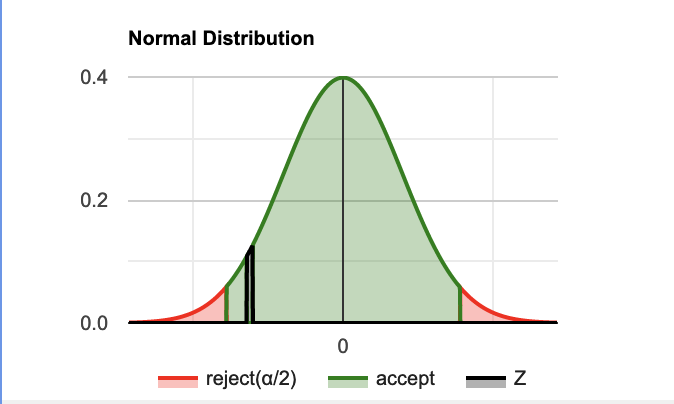
Figure 3. 2 sample z-test results comparing scores of students who studied alone and those who studied in groups.
A two sample Z-test performed, with the mean score of the group of students having studied individually being 83.7, and the mean score of students who studied in groups being 88.04. The standard deviations of the groups were 7.9 and 8.9, respectively. After being ran, the z-test revealed a z-statistic of -1.02 and a p-value of 0.30.
Discussion
The findings of the survey showed that there was no significant difference in how well students who worked in groups and students who worked alone did. The p-value calculated reveals that there was a 30% chance that we collected the data that we did if the averages were truly the same, which is not enough to reject the null hypothesis that there is no difference between the sample means (Figure 3).
Overall, there was a positive correlation between the number of students per group and how well students did. Besides groups of 2-3 students, grades increased from averaging an 83.7% among those who studied alone to 95.5% among those who worked in groups with 5 or more people. This large increase may be partially attributed to a small sample size of those who worked with groups of 5 or more people (n=4).
It was found that Freshmen and Sophomores were more likely to work in groups than Juniors and Seniors (Figure 2). This may be because they look to be more social because they may not know as many people as Juniors and Seniors. Additionally, Freshman were more likely to switch their study habits compared to all other grades. Freshmen are still adjusting to college, so they should be more willing to try new strategies.
Some limitations of this study were that it wasn’t possible to survey all students at CCNY who took science classes this semester. Furthermore, response bias has to be considered, as students may have been embarrassed to share low grades, making the mean higher than it should be. Another study measuring how long students study as well may be useful, as that is another factor parallel to study methods that affects student performance on exams.
References
Rybczynski, S. M., & Schussler, E. E. (2011). Student use of out-of-class study groups in an introductory undergraduate biology course. CBE life sciences education, 10(1), 74-82.
Final Version:
Effect of Group and Individual Studying Habits on Science Exam Scores
Ashley Mota, Bilal Siddiqui, and Rania Ebrahim
Abstract
If planning on using a study group as a way to study, it is important to know how the use of a study group correlates with the scores attained on a test. Surveys were conducted in this study to collect data which would give insight to answering this question. 57 participants of varying ages, genders, and majors were asked a series of questions amongst which were: “What was your last grade on a science exam?” and “How many people did you study with?” It seemed that the more people studied with (5 or more), the higher the average exam scores were (mean of 95.5). Even when looking at the individual grades, the grades that had more students studying in groups (Sophomores) seemed to have higher average exam scores (89.5). However, a 2 sample z-test that we performed revealed that there was no statistically significant difference between how well students in groups and those who studied alone did. More research can still be done to explore any other factors that could have affected the high exam score, like how long the students were studying for, were they studying with friends and goofing off, did they get enough sleep, and/or what was their level of prior knowledge in the subject.
Introduction
Getting good grades in one of the most important goals for college students. How well students do is chiefly determined by their study habits. While the more one studies has a positive effect on scores, other study habits may influence exam grades as well (Barbarick and Ippolito 2003). The goal of this study was to determine whether individual studying or studying in groups for science exams is most effective for students at the City College of New York, along with determining whether or not students would be open to changing their study habits. Generally, science exams cover a wide range of topics. Because of this, it is hypothesized that students who work in groups will have scored better than those who study individually. Studying in groups allows students to explain to each other topics they may be weak in, and they may be able to better understand their peers’ explanations, rather than a professor’s (Rybczynski, 2011). Furthermore, it is believed that Freshmen and Sophmores will be the most open to changing study habits, as they may not have figured out what the best way for them to study is.
Methods
The participants of this experiment were 60 City College of New York undergraduate students (30 female and 30 male) from different majors such as computer science, engineering, biology, philosophy, etc. A survey was given with several questions on their study habits. Questions about gender, age, major, year of college, grade of last science exam, the average number of people they study with, and would they change the average number of people that they mostly studied with or not were asked. The participants were chosen randomly around the CCNY campus in the cafeteria, computer lab, and entrances to buildings. The library was considered an unsuitable place to ask students to do the survey because it would be obvious to observe who was studying independently or in group, which would eliminate randomness. Data collected from survey answers were used to indicate the relationship between study groups and better grades. Once data was collected, an excel sheet was used to organize the different patterns observed. A 2 sample Z-test was performed to calculate whether or not the data collected supported the hypothesis.
Results
As shown below in Figure 1, the average exam score of: those who studied by themselves (46.7% of the people surveyed) was 86.1, those in groups of 1-2 people (31% of the people surveyed) was 80.2, in groups of 3-4 (12%) was 92.2, and group of 5 or more (6.7%) was 95.5.
Figure 1. Depiction of the relationship between # of people in a study group and how they scored on their latest science exam.
When looking at the individual grades of the participants, it was noticed that 17 of the participants were freshman (28%), 19 of them were Sophomores (32%), 12 of them were Juniors (19%), and 12 of them were Seniors (21%). Seniors were more likely to study by themselves and rarely in groups, whereas nearly half of freshman studied alone. Sophomores were most likely to study in groups, mostly in sizes of 1-2 other people. Slightly over half of Juniors studied by themselves. Figure 2depicts this information.
Figure 2. A stacked bar chart showing the distributions of how each grade studied
The average exam scores were then found per grade. Freshman and Seniors, who had high percentages of studying by themselves, were found to have the lowest scores, 80.53 and 83.7 respectively. Sophomores, who had a high percentage of studying in groups, had the highest scores at 89.5, while Juniors came in at second with an average score of 86.7.
A two sample Z-test was performed to see if the data was significant. The mean score of the group of students having studied individually was 86.1, and the mean score of students who studied in groups being 84.5. The standard deviations of the groups were 8.3 and 17.8, respectively. After being ran, the z-test revealed a z-statistic of 0.45 and a p-value of 0.65. The resulting probability curve is shown below in Figure 3.

Figure 3. 2 sample z-test results comparing scores of students who studied alone and those who studied in groups.
Pie charts, Figure 4, were created based on the survey data to determine whether the students would change their study habits or not. Freshmen had the highest number of students who said they would change their study habits due to their grades. Sophomores, juniors, and seniors had very low numbers of students who were willing to change their study habits.

Figure 4. Pie charts demonstrating the percentage of people who would and wouldn’t change their study habits from each year of college.
Discussion
The findings of the survey showed that there was no significant difference in how well students who worked in groups and students who worked alone did. The p-value calculated reveals that there was a 65% chance that we collected the data that we did if the averages were truly the same, which is not enough to reject the null hypothesis that there is no difference between the sample means (Figure 3).
Overall, there was a positive correlation between the number of students per group and how well students did. Besides groups of 2-3 students, grades increased from averaging an 86.1%, among those who studied alone, to 95.5%, among those who worked in groups with 5 or more people. This large increase may be partially attributed to a small sample size of those who worked with groups of 5 or more people (n=4).
It was found that Freshmen and Sophomores were more likely to work in groups than Juniors and Seniors (Figure 2). This may be because they look to be more social because they may not know as many people as Juniors and Seniors. Additionally, Freshman were more likely to switch their study habits compared to all other grades. Freshmen are still adjusting to college, so they would be more willing to try new strategies. No Seniors and Juniors surveyed worked in groups of 5 or more, most likely because not enough people were surveyed.
Some limitations of this study were that it wasn’t possible to survey all students at CCNY who took science classes this semester. Furthermore, response bias has to be considered, as students may have been embarrassed to share low grades, making the mean higher than it should be. Another study measuring how long students study as well may be useful, as that is another factor parallel to study methods that affects student performance on exams.
References
J.A.Barbarick, K., & Ippolito, J., 2003. Does the Number of Hours Studied Affect Exam Performance. Journal of natural resources and life sciences education [Internet]. [cited 2019 March 27];32, 32-35. Available from https://pubag.nal.usda.gov/catalog/326180
Rybczynski, S. M., & Schussler, E. E., 2011. Student use of out-of-class study groups in an introductory undergraduate biology course. CBE life sciences education [Internet].[cited 2019 March 27]; 10(1). Available from https://www.agronomy.org/files/jnrlse/issues/2003/e02-14.pdf
